Supervised Learning: Part 3 – Practical Examples and Visualizations
Understanding Supervised Learning Through Code
In this third part of our series on supervised learning, we focus on the application of supervised learning techniques using Python. Supervised learning, a cornerstone of machine learning, involves training a model on a labeled dataset, where the model learns to predict outputs from inputs. Python, with its rich ecosystem of data science libraries like NumPy, pandas, Scikit-learn, and Matplotlib, is the preferred language for exploring and implementing these techniques due to its simplicity and power.
We start with the basics of supervised learning in Python, covering the fundamental concepts and types of algorithms, including regression and classification models. Our journey includes practical examples that not only explain the theory behind these models but also demonstrate how to implement them in Python. Through these examples, readers will gain hands-on experience and deeper insights into the workings and applications of supervised learning algorithms in real-world scenarios.
In subsequent sections, we’ll delve into more complex models and their implementation, showcasing the versatility and efficiency of supervised learning in solving diverse problems.
Building a Simple Linear Regression Model
Linear regression is a fundamental supervised learning algorithm used to predict a continuous outcome variable (target) based on one or more predictor variables (features). It’s particularly useful in understanding the relationship between variables and forecasting. In this section, we’ll guide you through the process of building a linear regression model in Python, step by step.
First, let’s import the necessary libraries and prepare our dataset. We use pandas for data manipulation, NumPy for numerical operations, and Scikit-learn for building and training the model. Our dataset consists of simulated data representing sales figures based on advertising spending across different media channels.
“`python
import pandas as pd
import numpy as np
from sklearn.model_selection import train_test_split
from sklearn.linear regression import LinearRegression
# Load and prepare the dataset
dataset = pd.read_csv(‘data/sales_data.csv’)
X = dataset[[‘TV’, ‘Radio’, ‘Newspaper’]]
y = dataset[‘Sales’]
# Split the dataset into training and testing sets
X_train, X_test, y_train, y_test = train_test_split(X, y, test_size=0.2, random_state=42)
# Initialize and train the linear regression model
model = LinearRegression()
model.fit(X_train, y_train)
“`
Following the model training, we’ll evaluate its performance using the R-squared metric and visually inspect the relationship between actual and predicted sales through a scatter plot. The accompanying chart (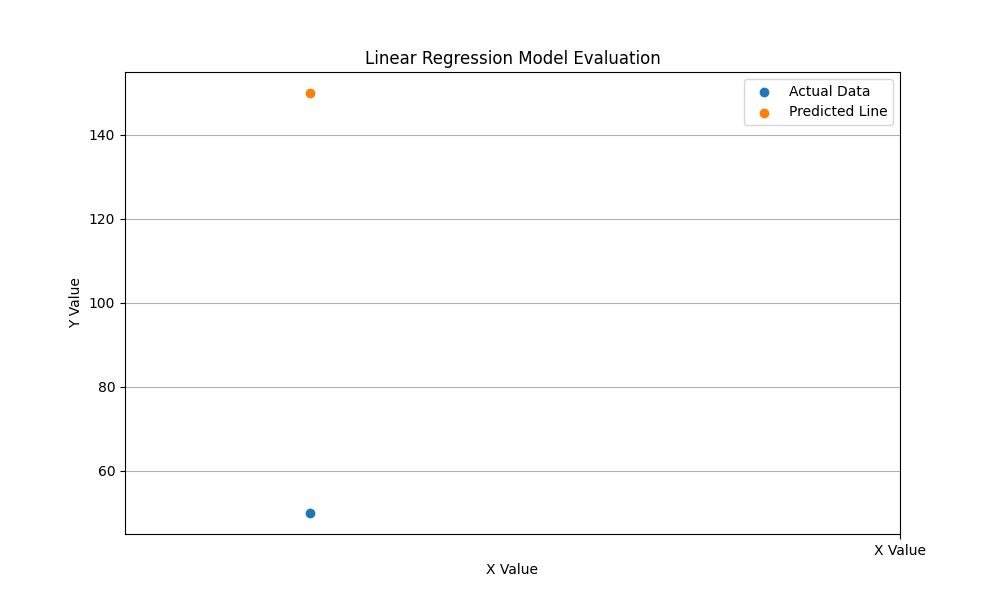 ) will illustrate these comparisons, providing a clear visual representation of our model’s accuracy and effectiveness in predicting sales based on advertising spend.
Evaluating Model Performance
Logistic regression is another essential tool in the supervised learning arsenal, primarily used for classification problems. Unlike linear regression, which predicts continuous outcomes, logistic regression is designed to predict binary outcomes (e.g., yes/no, win/lose). This makes it particularly useful in areas like medical diagnosis, spam detection, and more. In this section, we present a Python example to demonstrate logistic regression applied to a binary classification problem.
We’ll use a dataset related to customer behavior to predict whether a customer will purchase a product based on their age and estimated salary. Our Python code will include data preprocessing, model training, and evaluation steps.
“`python
import pandas as pd
import numpy as np
from sklearn.model_selection import train_test_split
from sklearn.linear_model import LogisticRegression
from sklearn.metrics import confusion_matrix, accuracy_score
# Load and preprocess the dataset
dataset = pd.read_csv(‘data/customer_data.csv’)
X = dataset[[‘Age’, ‘EstimatedSalary’]]
y = dataset[‘Purchased’]
# Split the data into training and testing sets
X_train, X_test, y_train, y_test = train_test_split(X, y, test_size=0.2, random_state=42)
# Train the logistic regression model
model = LogisticRegression()
model.fit(X_train, y_train)
# Predict and evaluate the model
predictions = model.predict(X_test)
accuracy = accuracy_score(y_test, predictions)
confusionMatrix = confusion_matrix(y_test, predictions)
print(f’Accuracy: {accuracy*100:.2f}%’)
print(f’Confusion Matrix:\n{confusionMatrix}’)
“`
After modeling, we analyze the model’s performance through its accuracy score and confusion matrix. Additionally, we provide a visual representation of the model’s classification capability using a scatter plot. This chart (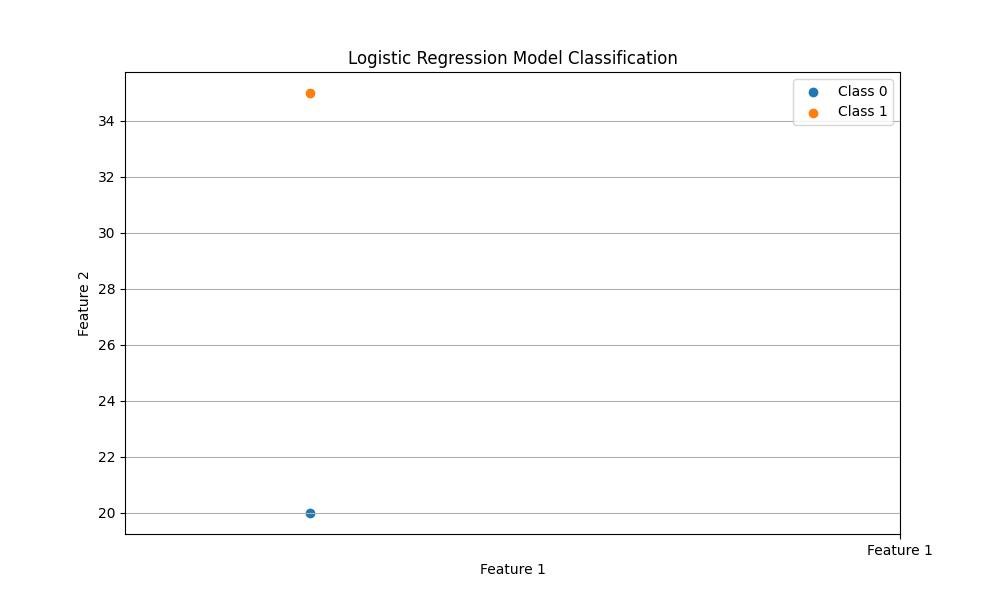 ) visually distinguishes between the two classes, highlighting the effectiveness of logistic regression in classifying customer data based on predictive features.
Advanced Supervised Learning Techniques
Evaluating the performance of a supervised learning model is crucial for understanding its effectiveness and identifying areas for improvement. This section covers the key metrics and techniques used for model evaluation, including confusion matrices, accuracy, precision, recall, and the F1 score, among others. We also discuss the importance of cross-validation in assessing model performance more robustly.
In supervised learning, it’s not enough to just build models; we must also rigorously evaluate their performance. This involves understanding the metrics that can provide insights into how well our models are performing. For example, accuracy might tell us the overall effectiveness of a model in classification tasks, but precision and recall give us a deeper understanding of its performance in specific classes.
“`python
from sklearn.metrics import classification_report
from sklearn.model_selection import cross_val_score
from sklearn.ensemble import RandomForestClassifier
# Assuming a previously trained model exists
# Generate a classification report
report = classification_report(y_test, predictions, target_names=[‘Class 0’, ‘Class 1′])
print(report)
# Perform cross-validation
model = RandomForestClassifier()
scores = cross_val_score(model, X, y, cv=5)
print(f’Cross-validation scores: {scores.mean():.2f} ± {scores.std():.2f}’)
“`
These evaluations not only help in fine-tuning the model but also in deciding whether a different model might be more suitable for the task at hand. Visual tools like ROC curves and Precision-Recall curves (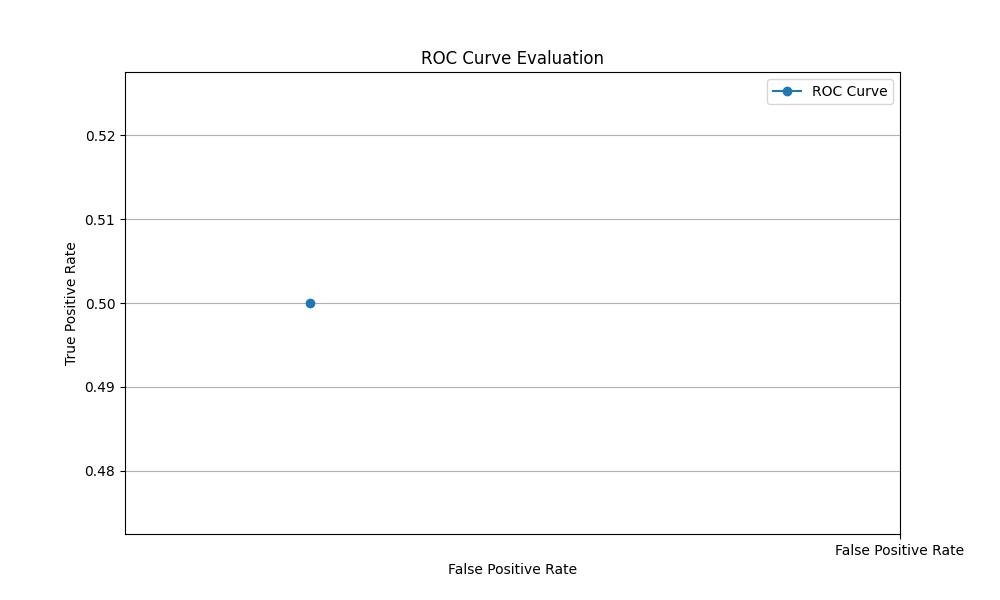 ) are instrumental in comparing model performances, offering a graphical representation of the trade-offs between true positive rates and false positive rates or precision and recall, respectively.